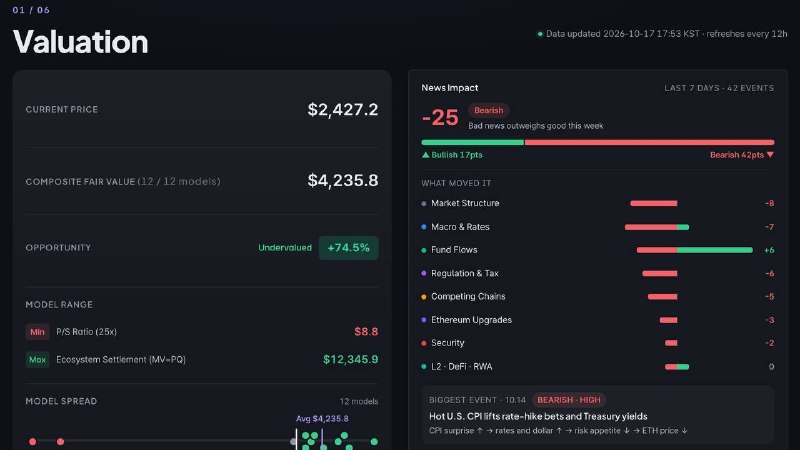
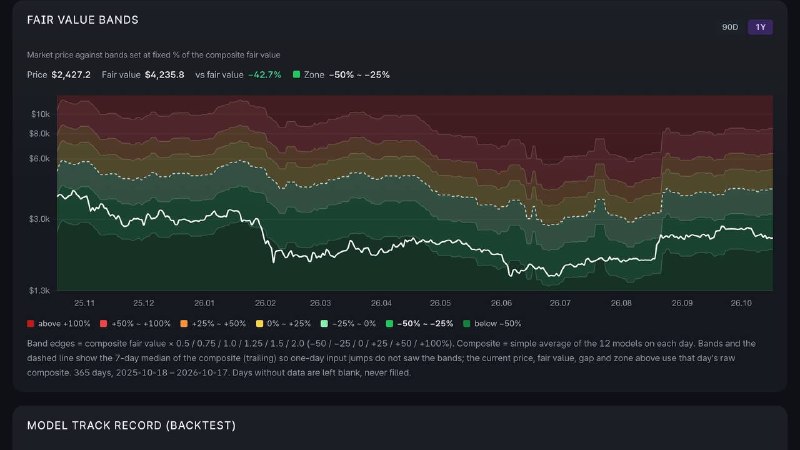
I gave ETHval its first major update in a while.
ETHval | Intrinsic Value DashboardETHval: Ethereum intrinsic value dashboard. 12 valuation models averaged into one composite ETH fair value, with on-chain fundamentals and model history.ethval.comOpenIt was my first vibe-coding project, which I started as soon as Opus 4.5 came out. I wanted to calculate Ethereum’s fair value myself, so I built it through conversations with AI. At first, I had little idea how much I could actually build.
More people used it after launch than I expected. Around that time, I reached number one on Kaito’s global ranking, and Hashed reached number one on its VC ranking. It was more attention than a small experiment deserved. Later, some visitors asked when the next update would come. I was grateful that they kept coming back, but it bothered me that I had not made improvements sooner.
Ethereum’s ecosystem has changed a lot since I first built it late last year. Institutional adoption is picking up, led by stablecoins and RWAs. Sending money and issuing assets on blockchains are becoming part of financial institutions’ actual work.
An unchanged price does not mean intrinsic value or fair value has stood still. But greater institutional use alone does not guarantee that ETH will become more valuable. Where usage grows and where the rewards accumulate may be different places.
Research also differs in how it views ETH. VanEck estimates revenue from transaction fees, MEV, and providing security, then discounts future cash flows to present value. CoinShares adds its value as money and collateral, considering demand from staking, DeFi, and institutional holdings. Other approaches emphasize the ecosystem’s scale and network effects. The difference is not just in the calculations. The starting point changes depending on whether ETH is seen as an income-producing asset or as money and collateral people need to hold.


Which underlying metrics are changing, and how will those changes shape future fair value? We need more approaches that look beyond the current price to form and test hypotheses. I hope ETHval can be one of them.
For v1.0, I focused on examining the assumptions and limitations behind the results.
1. Twelve models are not twelve pieces of evidence
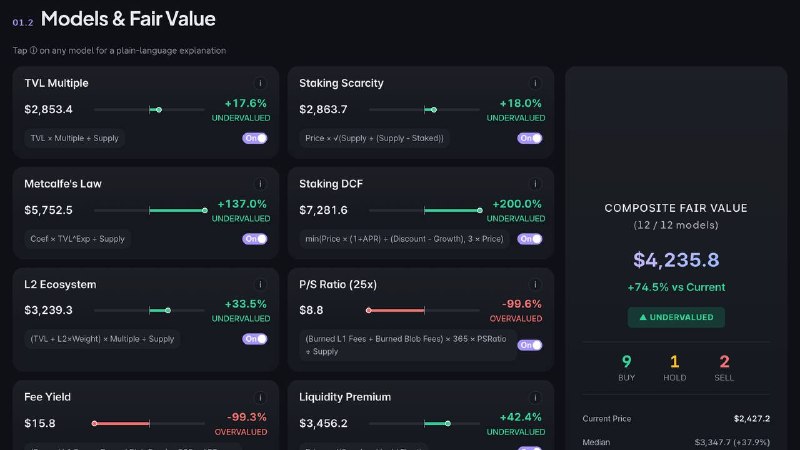
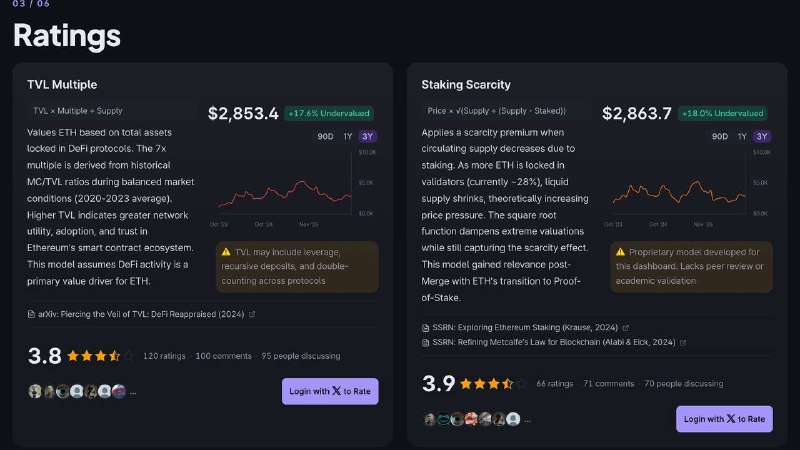
The eight valuation models have grown to twelve. But adding models that rely on the same data does not make the evidence more diverse. You can now compare the mean, median, and trimmed mean, and see how much the result changes when one model is left out. The aim is to examine how independent the agreement among the numbers really is.
2. Ask what a price requires, not just what the target is
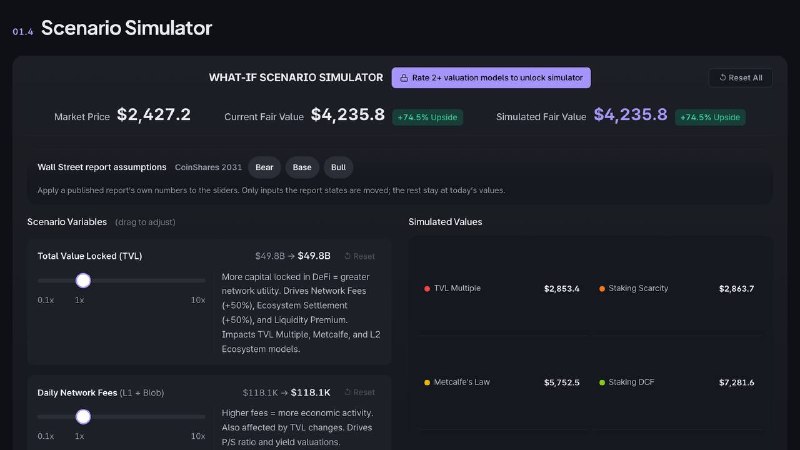
The scenario simulator lets you change conditions such as fees, transaction activity, and staking. I revised it so that the inputs on the screen mean the same thing in the actual calculations. Producing a desired price and asking whether the conditions needed for that price are realistic are different questions.
3. A forecast should retain the context in which it was published
I linked institutional forecasts to their original sources and publication dates, and made some available as starting points for simulations. Price targets circulate for a long time, but their assumptions can age sooner. To judge whether a forecast still holds, you need to check when it was made and under what conditions.
4. Between an explanation that fits the past and a prediction possible at the time
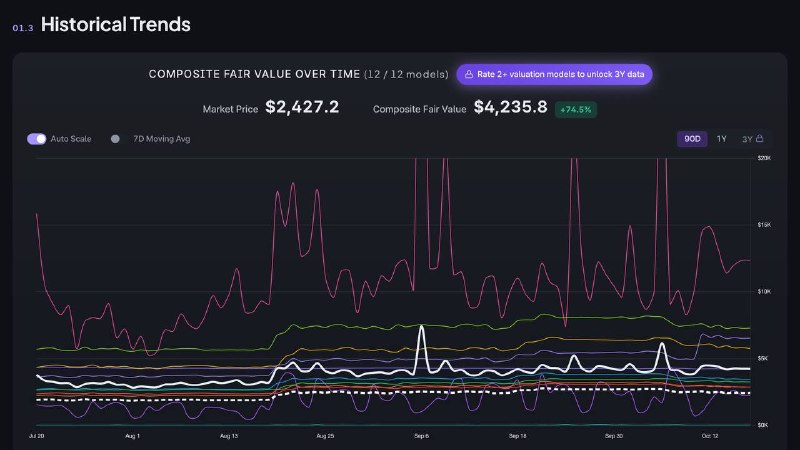
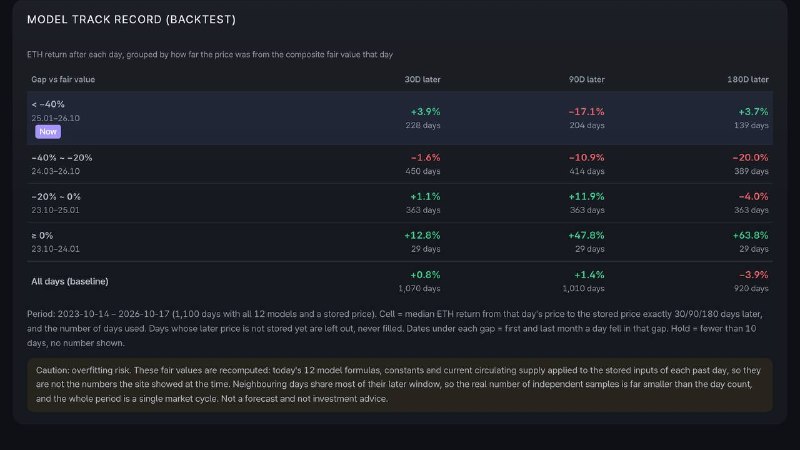
You can now see 30-, 90-, and 180-day returns after periods when valuations and market prices diverged widely, along with sample sizes. I also separated historical values reconstructed using today’s models from valuations actually recorded at the time. Performance can easily look good if you calculate as though what you know now was known back then.
5. Reasons are easy to attach after prices move
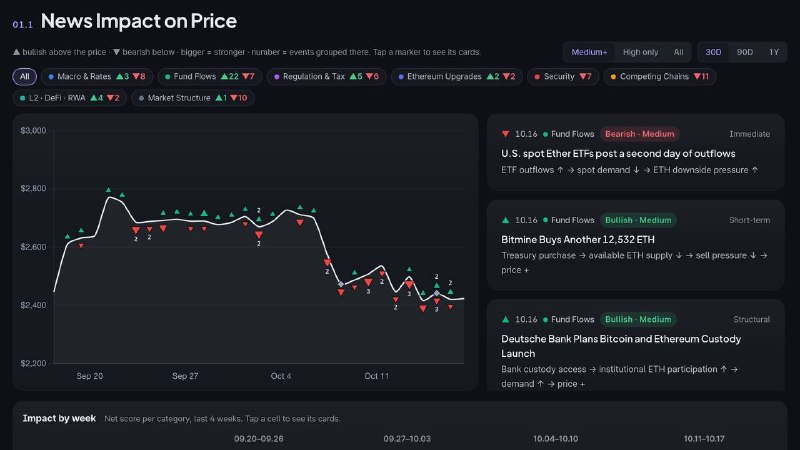
News Impact places major events and price movements on the same chart, letting you explore them by type and period. Putting them side by side does not establish causality. But even checking whether prices moved before the news can help guard against after-the-fact explanations.
6. A rising market is not the same as a correct judgment
I added comparisons with BTC for returns following news assessed as positive, and made it possible to distinguish repeated similar events and limited samples. When the whole market rises, even a mistaken interpretation can look right. I wanted to also show the results you could have achieved without that judgment.
7. Metrics with the same name do not always mean the same money
I added fee- and revenue-based relative valuations for ETH, BTC, and SOL. The money users pay, the money validators receive, and the value that accrues to token holders are not the same. Aligning their economic meaning was harder than putting the numbers in one table. Where there was not enough basis for comparison, I left values blank.
8. Tracing the link between ecosystem growth and token value
I organized fees, burns, staking, and Layer 2 activity to be read alongside interest rates and dollar indicators. Even if activity grows, fee revenue can fall when the cost per transaction drops. Rather than draw conclusions from usage alone, I wanted to examine how those changes feed into ETH’s supply and demand.
9. Fluent explanations do not fill gaps in the data
The site provides formulas and assumptions for each model, downloadable input data, and explanations in four languages. AI commentary is labeled with its generation time and the model used. The more natural an explanation sounds, the easier it is to feel that the calculation is trustworthy too. I made it possible to check the source data when questions arise.
10. Public analysis needs a path for objections to come back
I added share cards, embeds, and monthly reports. After the initial launch, I learned a lot from feedback pointing out things I had missed. I hope the sharing features help uncover and correct mistaken assumptions rather than simply spread conclusions.
I also improved the design, loading speed, and data consistency. I refined the reading flow on mobile and desktop, and made historical dollar conversions use prices from the relevant day. I tried not to mix sources with different definitions, and to leave missing values missing. Sometimes correcting basic distinctions had to come before adding models.
ETHval is free to use. Sign in with X and leave feedback on at least two valuation models to access three years of history and the simulator. Please share any errors you find while using it, or perspectives you think need more work.
At first, I was amazed that I could build something by talking with AI. Revisiting the features and data after a long break made the distance between implementation and understanding clearer. Calculations have become faster, but which assumptions to trust is still not an easy question to answer.
The question I started with remains the same. What has changed a little is what else I need to examine to answer it.